Brand Health vs Corporate Reputation
YouGov BrandIndex vs RepTrak: A Side-by-Side Data Comparison
YouGov BrandIndex vs RepTrak comes down to scope. BrandIndex tracks 16 brand health metrics daily from a consumer panel, and corporate reputation is one of them. RepTrak builds its whole model around corporate reputation. It combines a Reputation Score and seven weighted Drivers within one multi-stakeholder model, benchmarked against named competitors and linked to business outcomes. If your team needs daily consumer tracking across thousands of brands, BrandIndex is built for that. If it needs a benchmarked reputation score across stakeholder groups, with Drivers that show what's moving it, that's RepTrak.
Key takeaways
Corporate reputation: BrandIndex measures it as one of 16 metrics; RepTrak builds its whole model around it.
Methodology: BrandIndex surveys a consumer panel daily; RepTrak asks client-selected stakeholders one standardized set of questions, tracked continuously.
Metrics: BrandIndex reports 16 brand health metrics; RepTrak reports a Reputation Score, seven weighted Drivers, and seven Business Outcomes.
Coverage: BrandIndex tracks 27,000+ brands in 55+ markets; RepTrak covers 6,000+ companies in 60+ countries.
Recall vs impact: In RepTrak’s 2025 data on 650+ campaigns, sport campaigns had above-average recall (32%) but below-average reputation impact (+8.9 points against +11.2).
Choosing: Start with BrandIndex for daily brand tracking and RepTrak for stakeholder reputation; the two answer different questions and can run side by side.
What is YouGov BrandIndex?
YouGov BrandIndex is a daily brand and competitor tracking platform. YouGov's BrandIndex product page lists 16 metrics across 27,000+ brands in 55+ markets. The data comes from a panel of 27 million+ members, with 15+ years of history. The metrics fall into three groups. Media and communication covers Advertising Awareness, Aided Brand Awareness, Attention, Buzz, and Word of Mouth Exposure. Purchase funnel covers Purchase Intent, Consideration, Current Customer, and Former Customer. Brand perception covers General Impression, Customer Satisfaction, Quality, Value, Corporate Reputation, Recommendation, and the overall Index.
The Index averages six of the perception metrics: General Impression, Customer Satisfaction, Quality, Corporate Reputation, Value, and Recommendation. According to YouGov's brand health guide, the company weights its data to national representation in each market.
What does RepTrak measure?
RepTrak measures corporate reputation. It combines a Reputation Score and seven weighted Drivers as integrated components of one multi-stakeholder model, benchmarked against named competitors and linked to business outcomes. The Drivers are Products & Services, Performance, Innovation, Leadership, Conduct, Citizenship, and Workplace. The seven Business Outcomes capture what stakeholders say they would do. They are Buy, Recommend, Say Something Positive, Trust to Do the Right Thing, Work For, Invest, and Benefit of the Doubt.
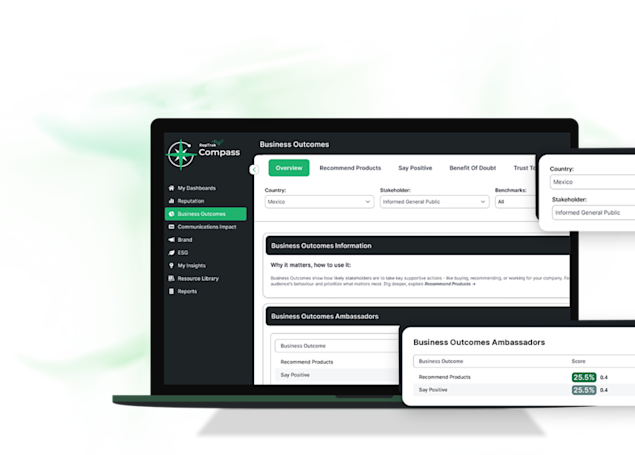
Clients select the stakeholder groups most relevant to their business, such as Employees, Customers, Policymakers, and Influencers. RepTrak draws on 20+ stakeholder types, and the number included varies by package. The score is tracked continuously through the RepTrak Compass platform.
BrandIndex treats corporate reputation as one input; RepTrak treats it as the subject
BrandIndex asks one question about corporate reputation: whether respondents would be proud or embarrassed to work for a company. That answer is one of 16 metrics and one of six averaged into the Index. In the Index, steady scores on Quality or Value can mask a drop in reputation.
RepTrak measures reputation through seven named Drivers, including Conduct, Citizenship, Leadership, and Workplace, alongside the Reputation Score. A change in the score traces to the Drivers behind it.
The platforms also split on awareness versus belief. RepTrak's analysis of 650+ campaigns across 40+ markets in 2025, published July 1, 2026, found 25% average recall and +11.2 points of average reputation impact. Sport campaigns reached 32% recall and delivered +8.9 points of impact. In that data, higher recall didn't bring higher reputation impact. Awareness metrics show whether a campaign was seen. Reputation measurement shows whether stakeholders think differently afterward.
BrandIndex also tracks Purchase Intent and Recommendation as separate metrics. RepTrak's research shows a correlation between Reputation Score increases and higher likelihood to buy or recommend.
The audience differs too. YouGov's public pages describe a panel weighted to national representation and don't describe separate groups such as employees or policymakers. RepTrak measures those groups when a client includes them.
BrandIndex surveys a consumer panel daily; RepTrak surveys client-selected stakeholders continuously
BrandIndex runs daily surveys of YouGov's panel, and each metric is a short question about a brand. Quality, for example, asks which brands respondents think represent good or poor quality. Daily data lets a team chart brand health around a launch or a news event. YouGov describes continuous validation, weighting, and fraud detection checks and doesn't publish a sample size per brand per day.
RepTrak asks stakeholders the same standardized questions, so scores compare across companies and stakeholder groups. RepTrak collects around 5 million ratings a year across its programs. For a typical IGP measurement, that's an average of more than 2,000 ratings per company in each country. The total depends on the stakeholder groups measured, the frequency of data collection, and the sample size. Respondents must be familiar with a company before they rate it, and must rate it on at least three of four reputation statements. The panel partner is Dynata, and some respondents are sourced elsewhere in some markets and stakeholder groups, all under the same quality checks. Every response is checked for speeders and failed attention checks. Results track continuously through Compass.
Side by side: BrandIndex leads on scale and cadence, RepTrak on reputation depth
The table compares the two platforms across ten dimensions, showing where they overlap and where they answer different questions.
| RepTrak | YouGov BrandIndex | |||
|---|---|---|---|---|
Core metric | Reputation Score (0-100), combined with seven weighted Drivers as integrated components of one model | Index: average of six brand perception metrics | ||
Metrics reported | Reputation Score, seven weighted Drivers, seven Business Outcomes | 16 metrics: 5 media and communication, 4 purchase funnel, 7 brand perception | ||
Corporate reputation | The whole model | One metric, asked as whether respondents would be proud or embarrassed to work for a company | ||
Who is surveyed | 20+ stakeholder types, client-selected; number varies by package | Panel members, weighted to national representation in each market; no separate stakeholder groups described publicly | ||
Data collection | Structured survey, one consistent instrument across companies and stakeholder groups | Daily surveys of YouGov's panel (27 million+ members) | ||
Cadence | Continuous, reported monthly through Compass, with 20+ years of history | Daily, with 15+ years of history | ||
Benchmarking | Client-selected competitive set compared on the same survey scale over time | Competitor and sector benchmarks across tracked brands | ||
Outcome linkage | Seven Business Outcomes linked to the score (Buy, Recommend, Say Something Positive, Trust to Do the Right Thing, Work For, Invest, Benefit of the Doubt) | Purchase funnel metrics (Purchase Intent, Consideration, Current and Former Customer) tracked alongside perception | ||
Scope | 6,000+ companies, 60+ countries, 30+ industries | 27,000+ brands, 55+ markets | ||
Access | Compass platform and API; demo request, pricing not published | Always-on platform and API; contact sales, pricing not published |
Reputation treatment and audience are the two rows that separate the platforms most. Scale and cadence are where BrandIndex leads.
BrandIndex covers more brands; RepTrak covers more stakeholder types
BrandIndex tracks 27,000+ brands in 55+ markets, which gives marketing teams a wider field of competitors to benchmark against. RepTrak covers 6,000+ companies in 60+ countries across 30+ industries. It gives communications teams a wider field of audiences: 20+ stakeholder types, chosen by the client within their package. BrandIndex tracks brands, including product brands. RepTrak measures companies.
Which platform fits which use case?
BrandIndex fits daily brand and campaign tracking. YouGov positions it for benchmarking against goals, competitors, and the whole market, with metrics that run from Advertising Awareness to Purchase Intent. 15+ years of history lets a team chart brand health before and after a launch.
RepTrak fits stakeholder reputation questions. Buy and Recommend speak to customer behavior, and Work For speaks to talent attraction. Benefit of the Doubt speaks to how stakeholders judge a company when something goes wrong. For campaigns, RepTrak's framework asks whether a metric is relevant, controllable, and meaningful, as laid out in the three tests every campaign KPI must pass.
What does YouGov BrandIndex do well?
BrandIndex's clearest strength is scale and cadence. Daily data on 27,000+ brands across 55+ markets, with 15+ years of history, lets marketing teams chart brand health around any launch or news event and compare it with competitors. Purchase funnel metrics sit next to perception, and the API feeds the data into internal BI tools. For daily consumer brand tracking at that breadth, BrandIndex is the stronger fit.
Should you choose YouGov BrandIndex or RepTrak?
Start with BrandIndex for daily consumer brand tracking across many brands and markets. Start with RepTrak for a benchmarked reputation score across stakeholder groups, with Drivers that show what's moving it. The two answer different questions, so they can run side by side.
Choose YouGov BrandIndex if your team needs daily consumer tracking, wants purchase funnel metrics next to perception, or needs long history across thousands of brands.
Choose RepTrak if your team needs stakeholder views beyond consumers, wants a continuously tracked benchmark, or needs to see which Drivers move the score.
If you want to know how your company's Reputation Score compares against named competitors, talk to us.
FAQ's
BrandIndex tracks 16 brand health metrics daily from a consumer panel. RepTrak measures corporate reputation through an overall Reputation Score and seven weighted Drivers, benchmarked against named competitors.
Yes, as one of 16 metrics. It asks whether respondents would be proud or embarrassed to work for a company, and it's one of six perception metrics averaged into the Index.
Sixteen: five media and communication metrics, four purchase funnel metrics, and seven brand perception metrics, including the overall Index.
BrandIndex surveys YouGov's panel, weighted to national representation in each market. RepTrak draws on 20+ stakeholder types, and clients select the groups most relevant to their business.
BrandIndex is updated daily. RepTrak's Reputation Score is tracked continuously through Compass.
BrandIndex tracks 27,000+ brands in 55+ markets. RepTrak covers 6,000+ companies in 60+ countries across 30+ industries.
YouGov doesn't publish BrandIndex pricing. Its product page directs buyers to contact sales.
RepTrak. Its benchmarked Reputation Score comes with seven named Drivers, so a shift in the number traces back to the Drivers behind it. BrandIndex gives a daily brand health Index.
Yes. BrandIndex shows daily brand performance with consumers. RepTrak shows how stakeholders view the company and which Drivers are moving the score.