RepTrak vs Kantar BrandZ: What's the Difference?
The difference between RepTrak and Kantar comes down to value versus belief. BrandZ prices a brand in dollars by multiplying financial value by consumer-driven brand contribution. RepTrak measures what stakeholders believe about a company and what they would do because of it. It combines a Reputation Score and seven weighted Drivers as integrated components of one multi-stakeholder model, benchmarked against named competitors and linked to business outcomes. If your team needs a brand valuation for the CFO, board, or investors, BrandZ is built for that. If it needs to know how stakeholders view the company and what's moving that view, that's RepTrak.
Key takeaways
Starting point: BrandZ starts with earnings and consumer research; RepTrak starts with stakeholders and has no financial input.
Weighting and cadence: BrandZ scales financial value by brand contribution and ranks annually; RepTrak weights seven Drivers and tracks continuously.
Use cases: BrandZ fits valuation and marketing-investment questions; RepTrak fits stakeholder trust and reputation reporting.
Brand: BrandZ prices a brand in dollars; RepTrak's Brand Intelligence scores corporate brand through stakeholder surveys.
Choosing: Start with BrandZ for brand value and RepTrak for reputation; the two answer different questions and can run side by side.
What is Kantar BrandZ?
Kantar BrandZ is a brand valuation platform that ranks the world's most valuable brands each year. Its research base covers 4.6 million+ consumer interviews, 22,392 brands, and 54 markets, according to Kantar's BrandZ methodology page. Brand Value equals a brand's financial value multiplied by its brand contribution. Financial value starts with the parent company's earnings, adjusted by an intangible ratio, an attribution rate, and a brand multiple that projects future earnings.
Brand contribution is the share of that value driven by brand equity. Kantar measures it through three consumer perceptions, known as MDS. A Meaningful brand meets emotional and functional needs, a Different brand sets trends, and a Salient brand comes to mind for key needs.
Kantar publishes the result as the Global Top 100 plus 13 category rankings. To qualify, a brand must belong to a listed company or to a private company with public financials.
What does RepTrak measure?
RepTrak measures corporate reputation. Its tracking footprint covers 6 million+ individual ratings, 6,000+ companies, 60+ countries, and 30+ industries. Its Reputation Score and seven weighted Drivers work as integrated components of one model. The Drivers are Products & Services, Performance, Innovation, Leadership, Conduct, Citizenship, and Workplace.
RepTrak’s model follows Think-Feel-Do, the counterpart to Kantar’s MDS. The Drivers capture what stakeholders think, and the Reputation Score captures how they feel. The seven Business Outcomes capture what they would do. They are Buy, Recommend, Say Something Positive, Trust to Do the Right Thing, Work For, Invest, and Benefit of the Doubt.
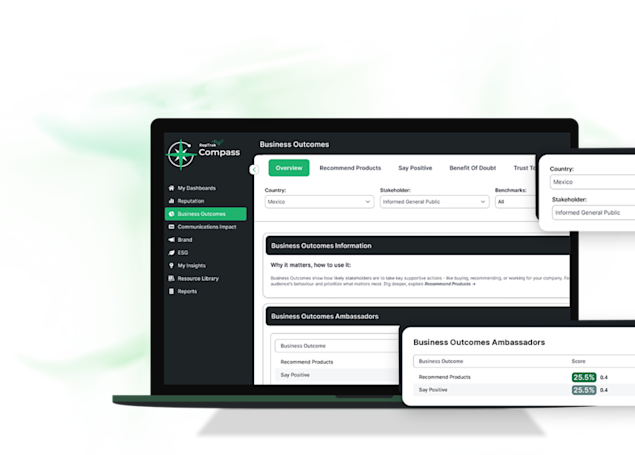
Clients select the stakeholder groups most relevant to their business, such as Employees, Customers, Policymakers, and Influencers. RepTrak draws on 20+ stakeholder types, and the number included varies by package. The score is tracked continuously through the RepTrak Compass platform.
BrandZ starts with earnings; RepTrak starts with stakeholders
BrandZ starts with earnings and applies consumer brand equity to them. RepTrak starts with stakeholders and counts financial performance only as stakeholder perception, through the Performance Driver.
RepTrak’s own data shows the gap. RepTrak’s analysis of Meta’s 2021 rebrand tracked the company’s Reputation Score through the change. It fell from 48.5 in Q3 2021 to 45.6 in Q4 2021, the quarter of the rebrand, and stood at 45.8 in early 2022. The new name changed the brand but not what stakeholders believed about the company.
BrandZ scales financial value by brand contribution; RepTrak weights Drivers
BrandZ scales financial value by consumer-driven brand contribution, with financial data drawn from S&P Capital IQ, public financial reports, Euromonitor, and Kantar. The ranking is annual, and Kantar reviews the methodology each year.
RepTrak weights with Drivers. Every stakeholder answers the same standardized set of questions, so scores compare across companies and stakeholder groups. The Drivers and Reputation Score sit in one model, linked to the seven Business Outcomes, and tracking runs continuously.
A BrandZ value moves when earnings or consumer equity move. A RepTrak score moves when stakeholder perception moves, and the Drivers show where the movement sits.
Side by side: BrandZ prices a brand, RepTrak scores a reputation
The table compares the two platforms across ten dimensions, showing where they overlap and where they answer different questions.
| RepTrak | Kantar BrandZ | |||
|---|---|---|---|---|
Core metric | Reputation Score (0-100), combined with seven weighted Drivers as integrated components of one model | Brand Value in dollars: financial value multiplied by brand contribution | ||
Corporate reputation: what stakeholders think, feel, and say they would do | Brand equity and its contribution to a brand's financial value | What it measures | ||
Perception framework | Think-Feel-Do: Drivers cover what stakeholders think, the Reputation Score captures how they feel, seven Business Outcomes capture what they would do | MDS: Meaningful, Different, Salient | ||
Who is surveyed | 6 million+ individual ratings across 20+ stakeholder types, client-selected; number varies by package | Consumers: 4.6 million+ interviews across 54 markets | ||
Financial input | Parent company earnings, intangible ratio, attribution rate, brand multiple | None. Financial performance enters only as stakeholder perception through the Performance Driver. | ||
Outcome linkage | Seven Business Outcomes linked to the score (Buy, Recommend, Say Something Positive, Trust to Do the Right Thing, Work For, Invest, Benefit of the Doubt) | Brand contribution: the share of financial value driven by brand equity | ||
Cadence | Continuous, through Compass | Ongoing consumer research; annual ranking; methodology reviewed annually | ||
Benchmarking | Client-selected competitive set compared on the same survey scale over time | Brands ranked against each other in the Global Top 100 and 13 category rankings | ||
Scope | 6,000+ companies, 60+ countries, 30+ industries | 22,392 brands, 54 markets in the research base | ||
Ideal buyer | Teams that need a dollar brand value for finance, investors, or marketing-investment cases | Teams that need a benchmarked reputation score across stakeholder groups |
The financial input and audience rows separate the two most. BrandZ values brands from earnings and consumer research. RepTrak scores companies from stakeholder surveys.
BrandZ fits valuation questions; RepTrak fits stakeholder questions
BrandZ fits valuation and marketing-investment questions. Kantar's brand valuation article, lists uses including driving brand value growth, measuring marketing return, managing a brand portfolio, setting licensing rates, valuing sponsorships, and building an investor narrative. A dollar figure serves each of those finance-facing jobs.
RepTrak fits stakeholder questions. Leadership wants to know whether perceptions improved and whether goodwill grew. It also asks whether stakeholders are more willing to buy, recommend, invest, or work there.
The Business Outcomes map to stakeholder questions. Buy and Recommend speak to customer behavior, Work For to talent attraction, and Invest to investor relations. Benefit of the Doubt shows how stakeholders judge a company when something goes wrong.
RepTrak's Brand Intelligence measures corporate brand but doesn't price it
RepTrak scores corporate brand separately through RepTrak's Brand Intelligence product. Brand Scores sit alongside Reputation Scores. They show how stakeholders evaluate a company's corporate brand, how it compares with competitors, and which personality traits stakeholders associate with it.
Brand Scores are survey scores, not dollar values. RepTrak frames the link this way: brand is the promise a company makes, and reputation shows whether it keeps that promise.
What does Kantar BrandZ do well?
BrandZ's clearest strength is turning brand into a number finance already uses. A dollar value fits a board deck or an investor narrative without translation. A RepTrak score doesn't convert to dollars.
Kantar's methodology page lists accreditation from the Marketing Accountability Standards Board (MASB). Kantar also reports that brand accounts for roughly 30% of business value, and above 50% for the highest-performing brands. For consumer brand equity at that scale, BrandZ is built for the job.
Should you choose Kantar BrandZ or RepTrak?
Start with BrandZ if you need to know what a brand is worth. Start with RepTrak if you need to know how stakeholders view the company and what's moving that view. They answer different questions, so they can run side by side. BrandZ gives marketing and finance a brand value. RepTrak gives communications and corporate affairs a benchmarked reputation score, with Drivers that show where to act.
Choose Kantar BrandZ if your team needs a dollar brand valuation, wants consumer equity measured at scale, or must show marketing return in financial terms.
Choose RepTrak if your team needs stakeholder views beyond consumers, wants a continuously tracked benchmark, or needs to see which Drivers move the score.
If you're comparing reputation platforms, use RepTrak's five questions to ask any reputation intelligence vendor before you sign.
If you want to know how your company's Reputation Score compares against named competitors, talk to us.
FAQ
Kantar BrandZ measures brand value in dollars, combining financial value with consumer brand equity. RepTrak measures corporate reputation through a Reputation Score and seven weighted Drivers, benchmarked against named competitors.
No. BrandZ produces a brand value in dollars and a ranking. RepTrak’s Reputation Score is a 0-100 measure of how stakeholders feel about a company, and its seven Drivers show what they think.
Kantar multiplies a brand's financial value by its brand contribution. Financial value starts with the parent company's earnings, adjusted by an intangible ratio, an attribution rate, and a brand multiple. Brand contribution is the share driven by brand equity.
BrandZ surveys consumers. Kantar’s public materials describe consumer research only: how consumers rate brands as Meaningful, Different, and Salient, drawn from 4.6 million+ interviews across 54 markets. RepTrak draws on more than 6 million individual ratings across 20+ stakeholder types, and clients select the groups most relevant to their business.
BrandZ publishes an annual ranking, and Kantar reviews the methodology annually. RepTrak's Reputation Score is tracked continuously through Compass.
BrandZ answers what the brand is worth in dollars. RepTrak gives a benchmarked stakeholder reputation score, with Drivers that show what's moving it. Teams asked both questions can report both.
Not directly. BrandZ ranks brands owned by listed companies, or by private companies with public financials, and measures them through consumer brand equity and financial value. Its public materials don't describe a stakeholder-wide reputation score.
Yes. RepTrak's Brand Intelligence produces Brand Scores alongside Reputation Scores, based on stakeholder surveys. They're survey scores, not dollar values.
Yes. BrandZ shows what a brand is worth. RepTrak shows how stakeholders view the company and which Drivers are moving the score.